
The overall trend of the average temperature in March is characterized by sharp temperature swings depending on the year. March in the United States is often the month with a grab bag of temperatures and weather patterns where nearly any temperature can be expected. According to this graph, most of the decades have a warmer March average followed by a much cooler March the next year and there are very instances where there were similar average temperatures in a row. The average temperature in March fluctuated a lot from year to year until around 1970. Since then, the average temperature has been much higher overall which could be attributed to a cyclical warming trend but most likely the rapid rise can be tied to global warming trends. This year's average temperature was about 6 degrees Fahrenheit warmer than last year and we had much less snow this year than last year. This year's average temperature is also about 3 degrees Fahrenheit warmer than the average March temperature.

The overall trend on the graph of the average temperature in March in Wisconsin is very similar to the average temperature of the United States, but the actual average temperature is much lower. The average temperature is 28.3 degrees Fahrenheit, which is about 13 degrees cooler than the national average. This makes sense because we are directly in the path of the continental polar jet stream and frequently experience troughs of cold arctic air. As Wisconsinites, we pride ourselves on surviving our often temperamental and cold March weather.

The overall trend for precipitation in March for the United States is rainy or snowy years followed by years with much less precipitation. There are some decades that have a couple years in succession with similar levels of precipitation but they are usually close to the average of 2 to 3 inches. This year has much less precipitation in March than last year but we are still within the average range. The last decade has been much dryer than previous decades without any one March sticking out over the others for large amounts of precipitation. We have been having drought or near drought conditions in much of the United States for about the past ten years, so this trend is not surprising.
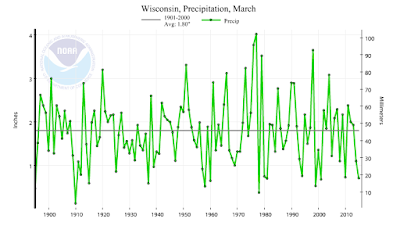
The overall trend for Wisconsin is lower average precipitation than the national contiguous state's average precipitation. Wisconsin has sharper swings between years though with some years having well above the average and others having very little precipitation at all. This year we had less precipitation than last year which is following the national drought trend. Besides a spike in 2002, we have had very little precipitation in the month of March for the last decade. We have been well below the average rate for six of the past fifteen years.

This is a graph showing the average temperature for two major cities in Wisconsin, Madison and Milwaukee. The cities have nearly the same average temperatures, but Madison has slightly cooler winters and a little warmer May - June than Milwaukee. January has the coldest/lowest value for both cities, and July has the warmest/highest value.

This is a graph showing the average rainfall for two major cities in Wisconsin, Madison and Milwaukee. These two cities are both located near large bodies of water (Milwaukee more so than Madison, obviously) so they both experience stronger precipitation than the surrounding areas because storms can pick up more moisture. Milwaukee has a big difference in average precipitation between April and May while Madison experiences a steady rise in precipitation through the summer months. January has the lowest average precipitation for both cities, but the month with the highest rainfall for Madison is August while it is April for Milwaukee.
CLIMOGRAPHS

Data: EAU CLAIRE COUNTY AP, CHIPPEWA COUNTY, WISCONSIN USA
Tables: 24- Hour Average Temperature (1961-1990) and Average Rainfall (1949-1995)

Data: MINNEAPOLIS INTL AP, HENNEPIN COUNTY, MINNESOTA USA
Tables: 24- Hour Average Temperature (1961-1990) and Average Rainfall (1950-1995)

Data: LA CROSSE MUNI AP, LA CROSSE COUNTY, WISCONSIN USA
Tables: 24- Hour Average Temperature (1961-1990) and Average Rainfall (1948-1995)

Data: MADISON DANE CNTY AP, DANE COUNTY, WISCONSIN USA
Tables: 24- Hour Average Temperature (1961-1990) and Average Rainfall (1948-1995)

Data: MILWAUKEE MTCHLL FLD, MILWAUKEE COUNTY, WISCONSIN USA
Tables: 24- Hour Average Temperature (1961-1990) and Average Rainfall (1948-1995)

Data: SUPERIOR, DOUGLAS COUNTY, WISCONSIN USA
Tables: 24- Hour Average Temperature (1961-1990) and Average Rainfall (1948-1995)

Data: WAUSAU MUNICIPAL AP, MARATHON COUNTY, WISCONSIN USA
Tables: 24- Hour Average Temperature (1961-1990) and Average Rainfall (1941-1995)
It is useful to compare data sets, especially when using a data set collected by professionals and another collected by an amateur. Looking at data for our area and in other areas around the Midwest also can identify regional trends and anomalies that are easier to see when using a larger collection of data.
2) What variables may influence differences between those locations and our location?
The distance each location is to bodies of water or expanses of land will cause variations between other cities and Eau Claire. These factors will contribute to or hinder storm growth and different cities usually have varying weather intensity, temperatures, and humidity levels.
3) How might these data vary from your data regarding your data collection technique?
No comments:
Post a Comment